
Private market investments offer the potential for positive risk-adjusted returns with inflation hedging, portfolio diversification, return enhancement and stable income. Not all private market investments, however, are created equal.
Fully understanding these strategies, associated risks, and benefits is key to selecting an investment that can help achieve client goals.
Why Alternative Investments: Private markets potentially open the door to more investment opportunities
Over the past three decades, the number of publicly traded companies in the U.S. has declined by almost half. More companies are opting to access financing through private markets and private lending rather than a traditional IPO. We believe private markets provide investors with the opportunity to access potentially attractive investments that are not available through the public markets, which, in our view, provides important diversification and return enhancement relative to a traditional portfolio invested solely in public markets.

Source: Federal Reserve Bank of St. Louis (FRED) as of March 2022, latest available
Benefits of Alternatives Allocation: Private markets have the potential to outperform public markets over the long run
The long-term benefits of an allocation to private equity can be seen from the excess returns generated on an initial investment of $100K over the past quarter century.
While the public markets generate a competitive return, from our research, private markets tend to outperform over the long run. A key differentiator of the private markets is the ability to generate value across business cycles.

Source: Bloomberg as of December 2023, latest quarter-end data available. Past performance is not indicative of future results. There can be no assurances that historical trends will continue. These returns do not reflect the portfolio of any specific investor, and there can be no assurances that any investor will receive the returns shown herein. Actual returns may be materially different.
The Power of Private Markets: It is generally harder today for investors to find meaningful sources of diversification in their portfolios
Traditionally, publicly traded stocks and bonds were considered the building blocks of a portfolio. A traditional portfolio was often considered meaningfully diversified when split with a 60% allocation to stocks and 40% allocation to bonds, where stocks would provide capital appreciation and bonds would provide downside mitigation and income. However, in recent years, rising stock-bond correlations have posed challenges to this traditional 60/40 portfolio.

Source: Bloomberg as of January 31, 2024. Correlation between stocks and bonds is represented by the average trailing 12-month correlations over the indicated periods. Stocks are represented by the S&P 500 Index. Bonds are represented by the Bloomberg US Aggregate Bond Index.
Private Markets: Beyond the 60/40 Portfolio
Historically private markets have provided meaningful downside mitigation across business cycles. From our research, over the past 5 years, an allocation to the private markets through private equity, private real estate, and private credit has resulted in higher annualized returns with lower volatility. These diversification benefits are possible as private markets may potentially offer return streams that have lower correlation to the public markets. Therefore, we believe the addition of private assets to a portfolio may boost risk-adjusted returns, and may act as a compelling complement to traditional holdings.
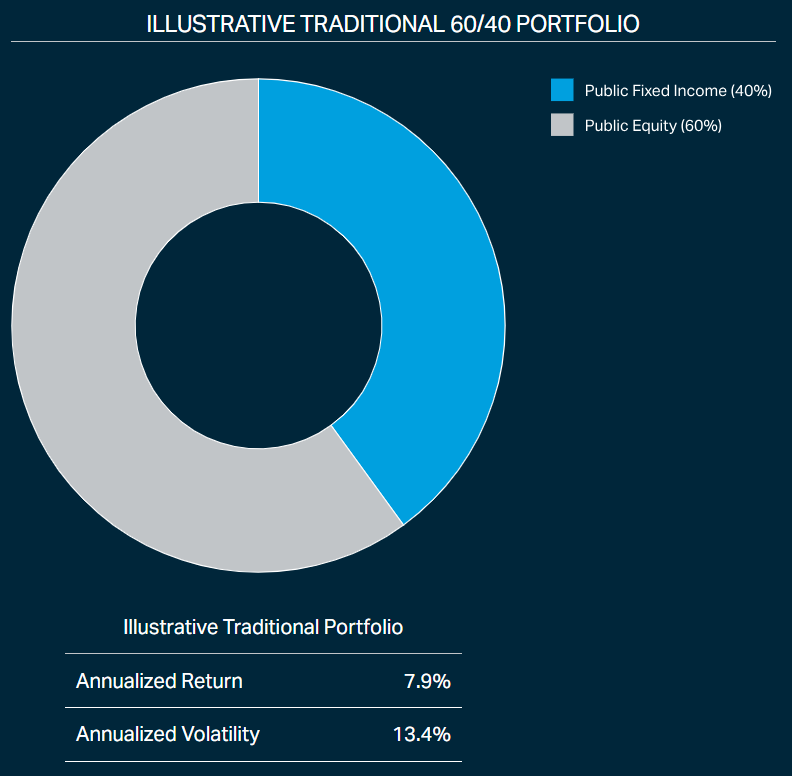
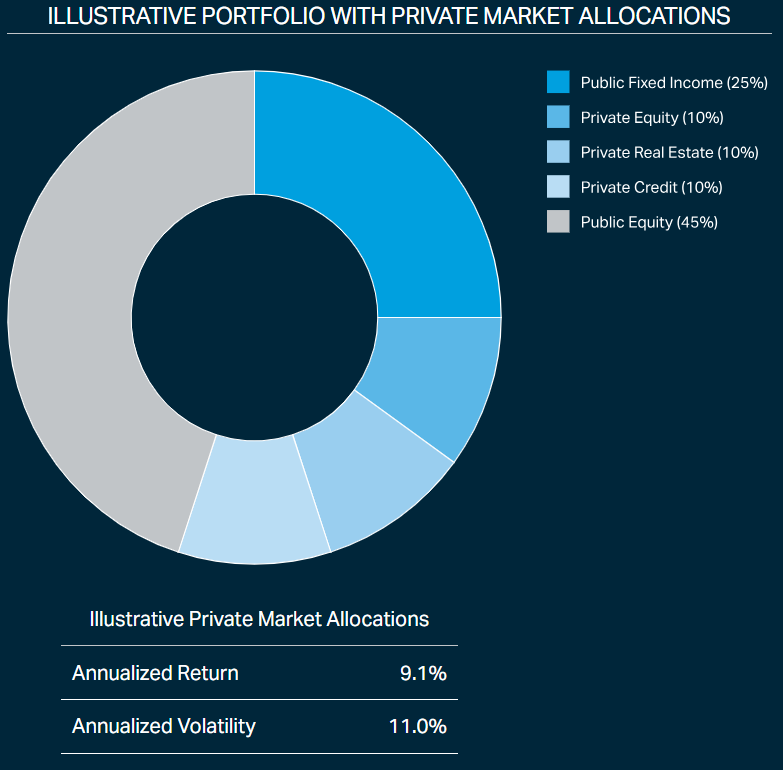
Source: Bloomberg, Cambridge Associates, NCREIF, as of December 2023, latest available. The 60/40 portfolio is 60% allocated to the S&P 500 Index and 40% allocated to the Bloomberg US Aggregate Bond Index. Private Credit is represented by the Cliffwater Direct Lending Index. Private Real Estate is represented by the NFI- ODCE Index. Private Equity is represented by the Cambridge Associates US Private Equity Index. Annualized returns and annualized volatility are calculated based on quarterly returns over the 5-year period from July 2018 to June 2023. Past performance is no guarantee of future results. The information herein is provided for educational purposes only. The benchmarks, indices and portfolio concentration provided herein were selected by Fortress for illustrative purposes only. Selection of such benchmarks, indices and/or portfolio concentration is inherently subjective and others might select other benchmarks, indices or portfolios based on their assessment of the market. These returns do not reflect the portfolio of any specific investor, and there can be no assurances that any investor will receive the returns shown herein. Actual returns may be materially different.